Carbon footprinting has become a fundamental practice for most organizations, as they actively pursue their climate objectives outlined in their sustainability policies. In 2022, the GBF (Global Biodiversity Framework) has been adopted during the COP15 in Montreal, Canada. The framework incorporates various targets, such as target 15, which directly mandates companies to disclose their biodiversity footprint, identify the primary drivers contributing to it, and outline their remedial actions to address the issue.
For companies operating in the European Union (EU), the EU Taxonomy and Due diligence legislation will also require biodiversity-related disclosures. In this section we share knowledge and resources on what biodiversity footprinting is, what it can do, and how it can be applied. You can also find several case studies showcasing various levels of assessments. In the BFFI section, you find more details on our specific method ("Biodiversity Footprinting for Financials") and numerous case studies showing its application in the financial sector.
For companies operating in the European Union (EU), the EU Taxonomy and Due diligence legislation will also require biodiversity-related disclosures. In this section we share knowledge and resources on what biodiversity footprinting is, what it can do, and how it can be applied. You can also find several case studies showcasing various levels of assessments. In the BFFI section, you find more details on our specific method ("Biodiversity Footprinting for Financials") and numerous case studies showing its application in the financial sector.
What is Biodiversity Footprinting?
Biodiversity footprinting serves as a valuable tool for multiple stakeholders, including organizations, companies, financial institutions, and individuals, enabling them to comprehend and quantify the environmental impacts resulting from their activities on biodiversity. A footprint starts with a model of all emissions and resources used in the supply chain of a company, project, product or service. Scientific models are used to calculate the impact on biodiversity resulting from all emissions and resources used in the supply chain.
The methodology used to calculate biodiversity footprints is most often Life Cycle Assessment (LCA). LCA is an established, science-based method to assess the environmental impacts related to a product or service. LCA is objective, it includes a wide variety of environmental problems and takes all life cycle stages into account; raw material extraction; manufacturing; distribution; use; and disposal. This holistic approach prevents accidentally shifting the burden or saying a product is ‘sustainable’ because it performs well in a specific life cycle stage or on one impact type while overlooking other stages of impact. Still, if focusing on one environmental problem is the right choice, LCA is flexible enough to do that too (in this case for biodiversity specifically).
Biodiversity footprinting results can be expressed in various metrics (see metrics and methods sections), and provide insights on where in the supply chain of the activity or product the largest impacts occur, so-called "hotspots".
Many organizations already measure their carbon footprint, water footprint, and sometimes others environmental issues ar ealso included. Since a few years the biodiversity footprint has come to attention of many. Biodiversity footprints are therefor designed to understand and report the impact an organization has on the decline or restoration of biodiversity and the main causes leading to this impact. With this insight they can evaluate and prioritize mitigating actions.
What can it do?
Biodiversity footprints provide insight in the environmental hotspots of products, services, organisations, or entire portfolios. This means that the results can be used to understand the environmental impacts of activities on biodiversity. The results can be split by the relevant driver. For example, if a truck is being used for transporting goods, the combusted fossil fuels can contribute to climate change (among others). Climate change in turn can impact biodiversity. There are many other drivers such as land use or water use that can also contribute to biodiversity loss. Biodiversity footprints allow you to understand what those drivers are, their relative importance, and how much specific activities contribute to those.
The results of biodiversity footprints can be used to improve internal structures, such as reducing the use of fossil energy sources towards renewables, or switching from animal-based inputs towards plant-based inputs. They can act as guiding compasses to reduce the impacts on biodiversity. They can also be conversation starters with suppliers or clients up- and downstream of the supply chain. Next to internal improvements and communication, they can also guide future decision making, by for example eliminating certain suppliers or companies from a portfolio (or replacing them with less impactful alternatives). Lastly, biodiversity footprinting can also be used for policy making.
The results of biodiversity footprints can be used to improve internal structures, such as reducing the use of fossil energy sources towards renewables, or switching from animal-based inputs towards plant-based inputs. They can act as guiding compasses to reduce the impacts on biodiversity. They can also be conversation starters with suppliers or clients up- and downstream of the supply chain. Next to internal improvements and communication, they can also guide future decision making, by for example eliminating certain suppliers or companies from a portfolio (or replacing them with less impactful alternatives). Lastly, biodiversity footprinting can also be used for policy making.
How can it be applied?
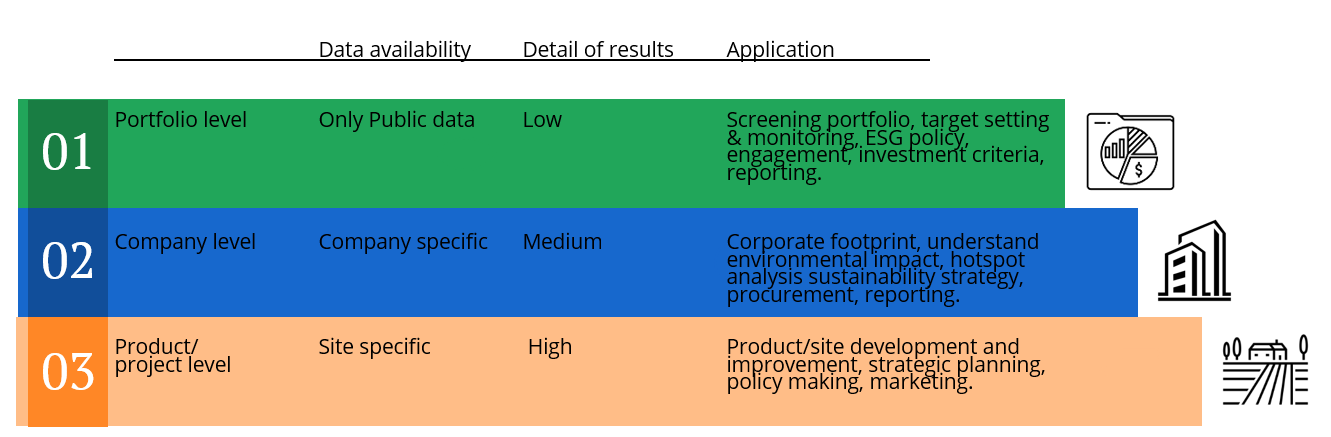
Biodiversity footprints can be performed on various levels. Depending on the system in scope and the intended application, the depth of biodiversity footprints can vary. In the following sections, we explain how you can perform a biodiversity footprint of product / project level, with the most granular coverage, on company level, or even on portfolio level. Those applications are examples and can go beyond what is portrayed.
Product or project biodiversity footprints
Assessing the biodiversity impact of individual products or projects is a powerful way to improve your product development, strategic planning and marketing. It can help companies be conscious of biodiversity in material selection and design and can even inform policy. Life cycle assessment (LCA) is an established, science-based method that is also excellent for biodiversity assessment on the product level. With LCA, we can assess the biodiversity impacts of all life cycle stages: raw material extraction, manufacturing, distribution, use, and disposal. The data needed is usually site-specific and granular, but provides a high detail of results, with the ability to dive deep.
Corporate biodiversity footprints
You can also assess your biodiversity impact on a corporate level, to gain insight in risks and opportunities and find the key drivers of your biodiversity impact. Whether your biodiversity goal is to reduce your impact or even become net positive, a corporate footprint helps you monitor your progress and report and communicate credibly. A corporate biodiversity footprint includes resource use, energy use and purchases. The data needs are company-specific, but often less granular than on product- or project level. It can ultimately be used for reporting.
Biodiversity footprints for financial institutions
The financial sector plays a key role in driving positive change towards more sustainable societies. Like many other financial institutions, you probably already weigh environmental, social and governance (ESG) data in your lending and investment decisions. With the biodiversity footprint for financial institutions (BFFI), you can add biodiversity to that list. With a biodiversity assessment (see BFFI section), you can calculate the biodiversity impact of individual investments and use it as an investment criterion. You can also evaluate and manage the risks of biodiversity impact and ecosystem service dependency of your investment. And, of course, the BFFI helps you monitor and report on your investment portfolio’s biodiversity footprints. The data needs are often the least granular due to the sheer size of investment portfolios.
PBAF Standard v 2022 Biodiversity impact assessment – Footprinting |
PBAF - Partnership for Biodiversity Accounting FinancialsThe Partnership for Biodiversity Accounting Financials (PBAF) is an independent foundation based in the Netherlands and a sister-initiative of PCAF (the Partnership for Carbon Accounting Financials), which has now grown into a truly worldwide initiative. PCAF and PBAF are actively supported by the Dutch government, strengthening the initiative’s linkages to the international policy level (EC, CBD) and related initiatives in the financial sector. PBAF aligns and cooperates constantly with these initiatives in the financial sector like the European Align project, the Taskforce for Nature related Financial Disclosures (TNFD) and the Finance for Biodiversity Pledge.
PBAF's primary aim is to develop the ‘PBAF Standard’. The PBAF Standard enables financial institutions to assess and disclose impact and dependencies on biodiversity of loans and investments. PBAF provides practical guidance to financial institutions on biodiversity impact and dependency assessment and defines what is needed in order for these assessments (either or not conducted by data providers) to deliver the right information to financial institutions. With this information financial institutions can effectively manage and report on biodiversity related risks and opportunities and contribute to the conservation and sustainable use of biodiversity. |
Case Studies of biodiversity footprinting
Company-level: a Multi-national Dairy Company

|
|
|
|
|
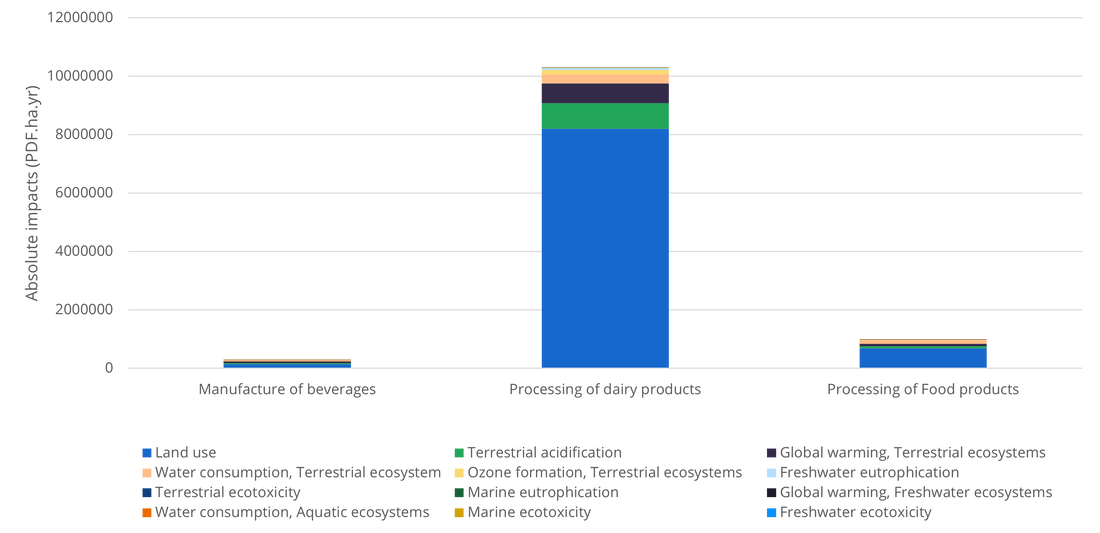
The biodiversity impacts can also be displayed per business sector, as per activity split. When we look at the results from that angle, then the dairy product sector dominates the impact (where, again, land use is the largest impact driver). |
|
.
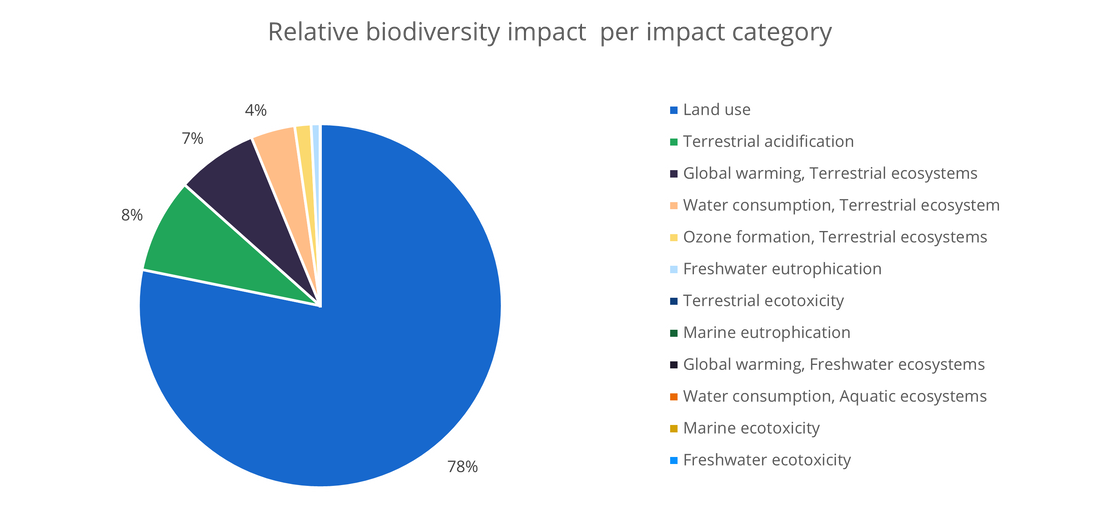
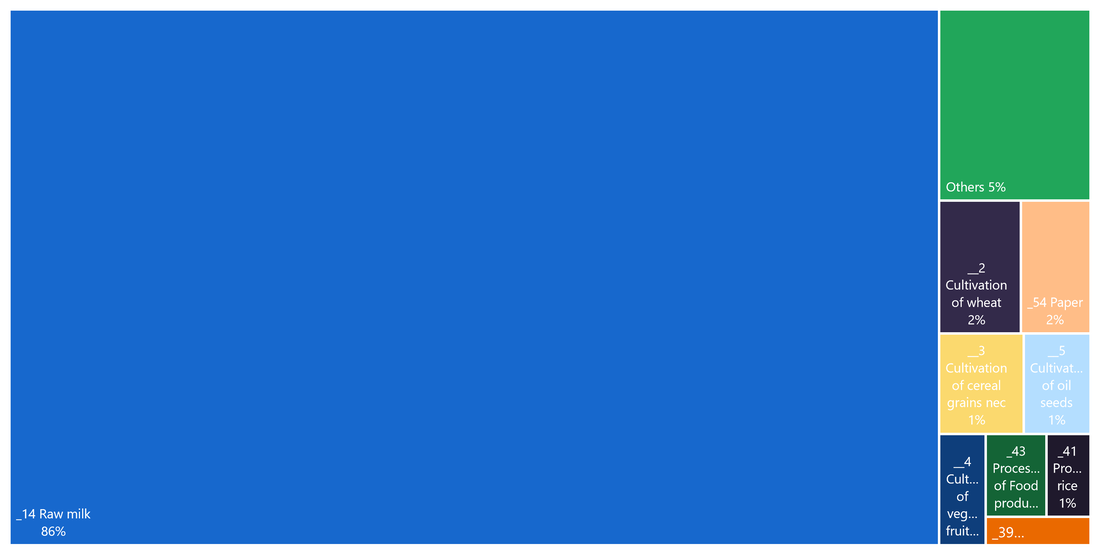
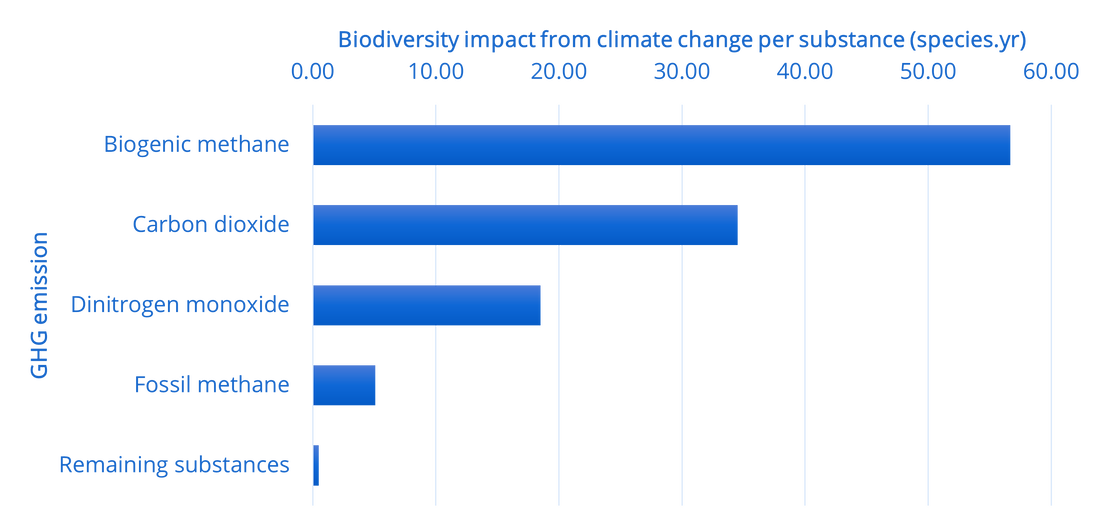
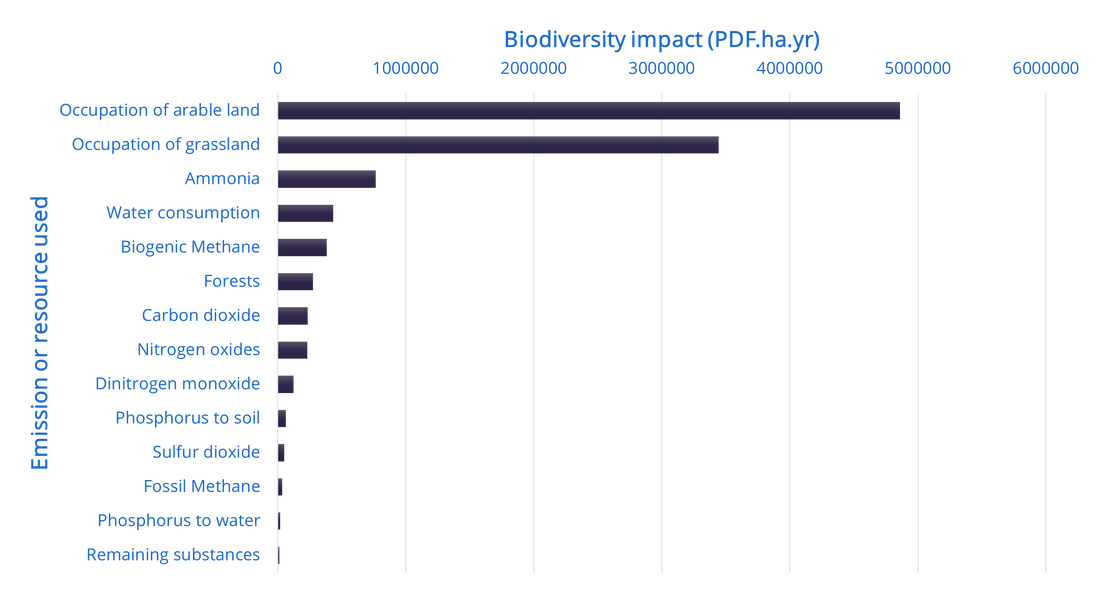
Another view is created if we assess the biodiversity impacts per product throughout the supply chain (right-hand side). There we see that from a process-contribution perspective, the milk product is the largest dominator of biodiversity impacts with 86% contribution. Below we see the results being portrayed by largest contribution of individual emissions and resource use to a specific impact driver, in this case to climate change. Right next to it is a similar example, only that it includes all impact drivers contributing to biodiversity impacts, not only climate change as portrayed on the left. |
|
|
|
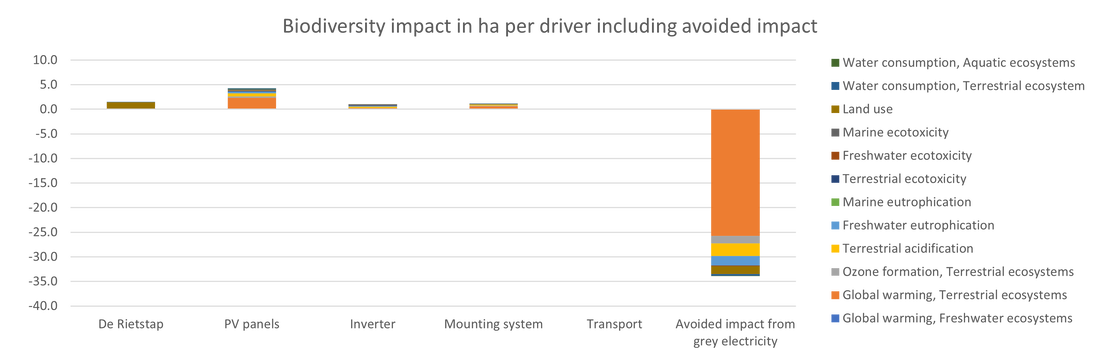
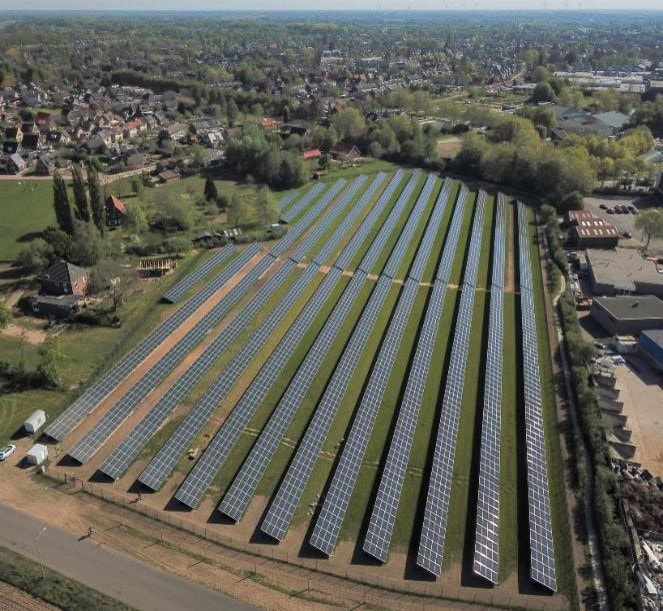
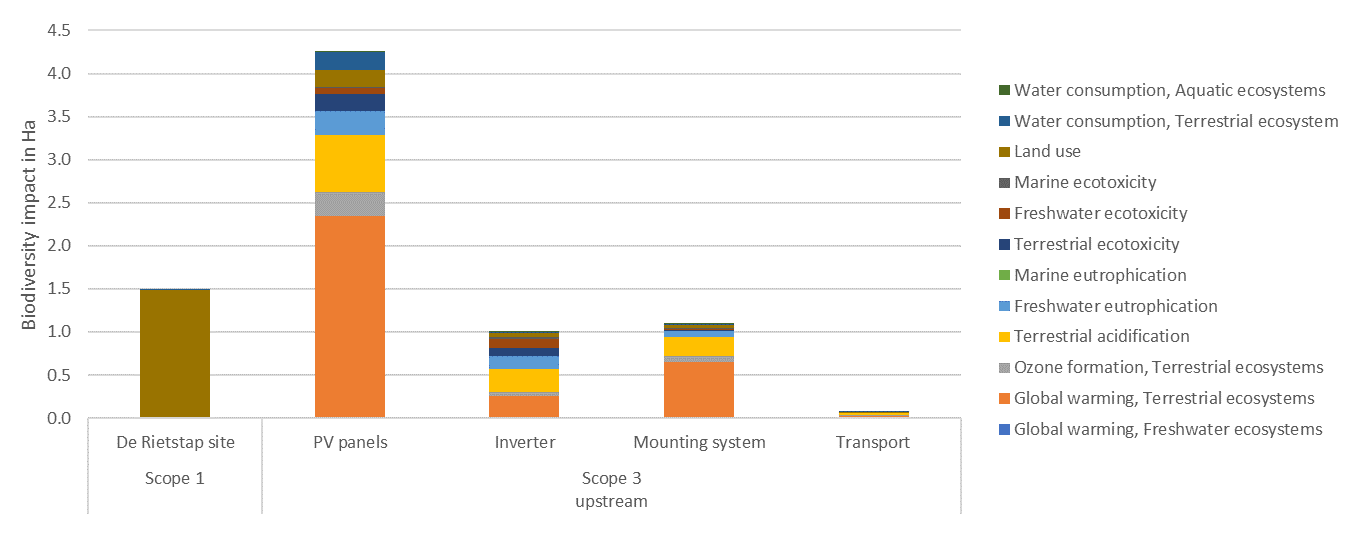
Project-level: Solar Park: "De Rietstrap"
|
For the biodiversity impact of a solar field itself, we estimate dthe loss of biodiversity based on a local inventory. In the Rietstrap project, a full scope 3 assessment was made:
For the impact on the solar field itself, we could estimate the loss of biodiversity based on a local inventory |
|
The results below cover the Scope 1 and Scope 3 (upstream) impacts, and show, that Scope 3 (thus purchased goods upstream) has a far greater biodiversity impact then the direct Scope 1 impacts on the field.
However, if we include the Scope 3 (downstream) impacts, we can put the impacts on site and from the upstream operations into perspective. Here we see that the avoided impact by replacing the grey electricity grid mix outweigh the caused impacts. This is to be treated with caution, as "avoided impact" or "positive impact" always raise the question - compared to what?