Biodiversity metrics, the indicators used to quantify biodiversity, are developed with several objectives in mind. Society is interested in understanding the overall state of biodiversity, especially the alarmingly high rate of species extinction. Industries and financials are interested in assessing the impact their activities have on biodiversity, so called biodiversity footprints, and their dependencies on biodiversity-related natural services. As opposed to carbon and climate change, there is currently no consensus on which common metrics to use for assessing biodiversity impacts. It can be confusing to see different metrics that aim at measuring the same thing. Therefore, we want to shed light on selected and most widely used metrics, what they mean and measure, and how to interpret them. A white paper at the bottom of the page, Bridging the Gap, explains how selected metrics are computed and used, and more importantly, how they relate to one another.
|
Sate Indicator Metric:
Living Planet Index (LPI) The Living Planet Index (LPI) is used by the WWF to monitor the alarming rate of species extinction every two years. It uses a dataset that traces the development (decline) of 17.000 species populations since 1970. This metric plays a dominant role in policy development. The white paper below explains why this metric is extremely sensitive to fast declines of a limited set of species. |
State Indicator & Footprint Metric: Mean Species Abundance (MSA) The Mean Species Abundance (MSA) metric has many similarities with the Living Planet index as it also is based on the development (decline) of species populations. It is however not very sensitive to monitoring extinction risks. It aims to describe the ecosystem intactness or the ecosystem functioning. Lately it has been used in Footprint calculations. |
Footprint Metric:
Potentially Disappeared Fraction of Species (PDF) The Potentially Disappeared Fraction of Species (PDF) has been developed as a footprint Metric for the use in Life Cycle Assessment. It indicates the potential loss of species due to a pressure, such as land occupation eutrophication, climate change, or other impact drivers. It does not measure final extinction, as the changes in a footprint are generally small compared to globally occurring extinction drivers. |
|
Footprint Metric for local impacts: Range Size Rarety (RSR) When local impacts of the construction of a dam or road are assessed, species populations will change. It is not possible or pragmatic to assess if this will lead to global extinction, so in the Range Size Rarity (RSR) approach the changes are relative to the local status or in this case: the Range. |
|
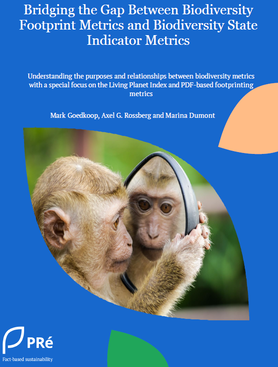
White paper: Understanding biodiversity metrics and how they are interrelated
|
This paper explains that existing biodiversity Footprint Metrics can also be directly related to biodiversity State Indicator Metrics, and this opens the possibility to develop equivalent policies around target setting. At first sight, this finding is somewhat surprising as these metrics can be defined very differently. For example, the concept of Potentially Disappeared Fraction of species (PDF), used in biodiversity footprinting, provides a good and relatively easy way to approximate how footprints impacting the LPI State Indicator Metric. With this paper, we also aim to build a bridge between the communities that use state indicator metrics and those that use Footprint Metrics, as indeed there seems to be little exchange of thoughts between them. For this reason, we summarize how several such metrics work. These summaries are far from complete but try to capture the essence. The purpose is to reduce the level of confusion about tools and metrics quantifying biodiversity impact, with the goal of providing guidance on which tools to use for which purpose. It is addressed to policymakers, businesses, NGOs and all who want to understand the developing landscape of biodiversity impact metrics and tools.
This whitepaper is based on a much more detailed mathematical and conceptual analysis by Axel Rossberg: Quantifying Biodiversity Impact. We strongly recommend reading this paper if you have the ability to read and understand mathematical formulas, as it provides all the details, assumptions and limitations. This paper can be downloaded here.
| |||||||
Bridging the Gap Webinar 5th June 2023
On 5th June 2023 we hosted a webinar about the white paper. The aim was to clarify the understanding of various biodiversity metrics and their relationships and show the applicability of biodiversity impact credits for linking individual impacts to policy targets. It was great to see such a large interest from a variety of different stakeholders throughout the webinar, asking relevant and interesting questions. To spread the knowledge further, we want to provide the recording and the slide deck, which you can find just below. You can donwload the slides here as PDF
|
Webinar Slide Deck
Your browser does not support viewing this document. Click here to download the document.
|
Webinar Video Recording
|
Biodiversity Impact Credits:
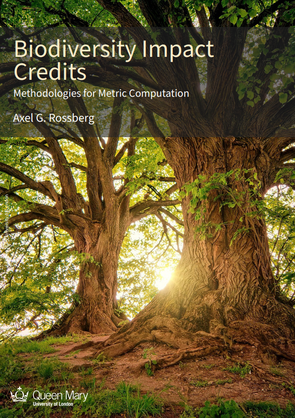
Methodologies for Metric Computation by Axel G. Rossberg
|
In this paper, Axel G. Rossberg describes Biodiversity Impact Credits (BICs) as a solution for private sector organisations that must account for biodiversity risk, and provide an auditable mechanism linking conservation practitioners with investors seeking conservation outcomes. The metric permits organisations to set themselves achievable, theoretically well-founded science-based targets for global biodiversity conservation. Similar to CO2 -emission equivalents in the climate context, BICs are not defined by a tool or methodology but through the logic of the underlying science. To compute their BICs, organisations can then choose from a variety of methodologies depending on the organizational and geographic scale considered, the relevant types of impact, affordability considerations, data availability, and the accuracy sought. This report presents three examples of such methodologies applicable in the context of tree and forest conservation. The first operates at the level of individual tree species, the second is based on the area of natural mixed forest gained or lost in a project, and the last permits measuring the global biodiversity footprint of an organisation or portfolio as resulting from resource use and emissions through supply chains. The brevity of the report reflects the simplicity of the BIC concept and its use.
| |||||||


